GGPLOT - guide_axis
Shows visual representation of position scales and then convert them with ggplotly.
p <- ggplot(mpg, aes(cty * 100, hwy * 100)) +
  geom_point() +
  facet_wrap(vars(class))
p <-  p + scale_x_continuous(guide = guide_axis(n.dodge = 2))
plotly::ggplotly(p)


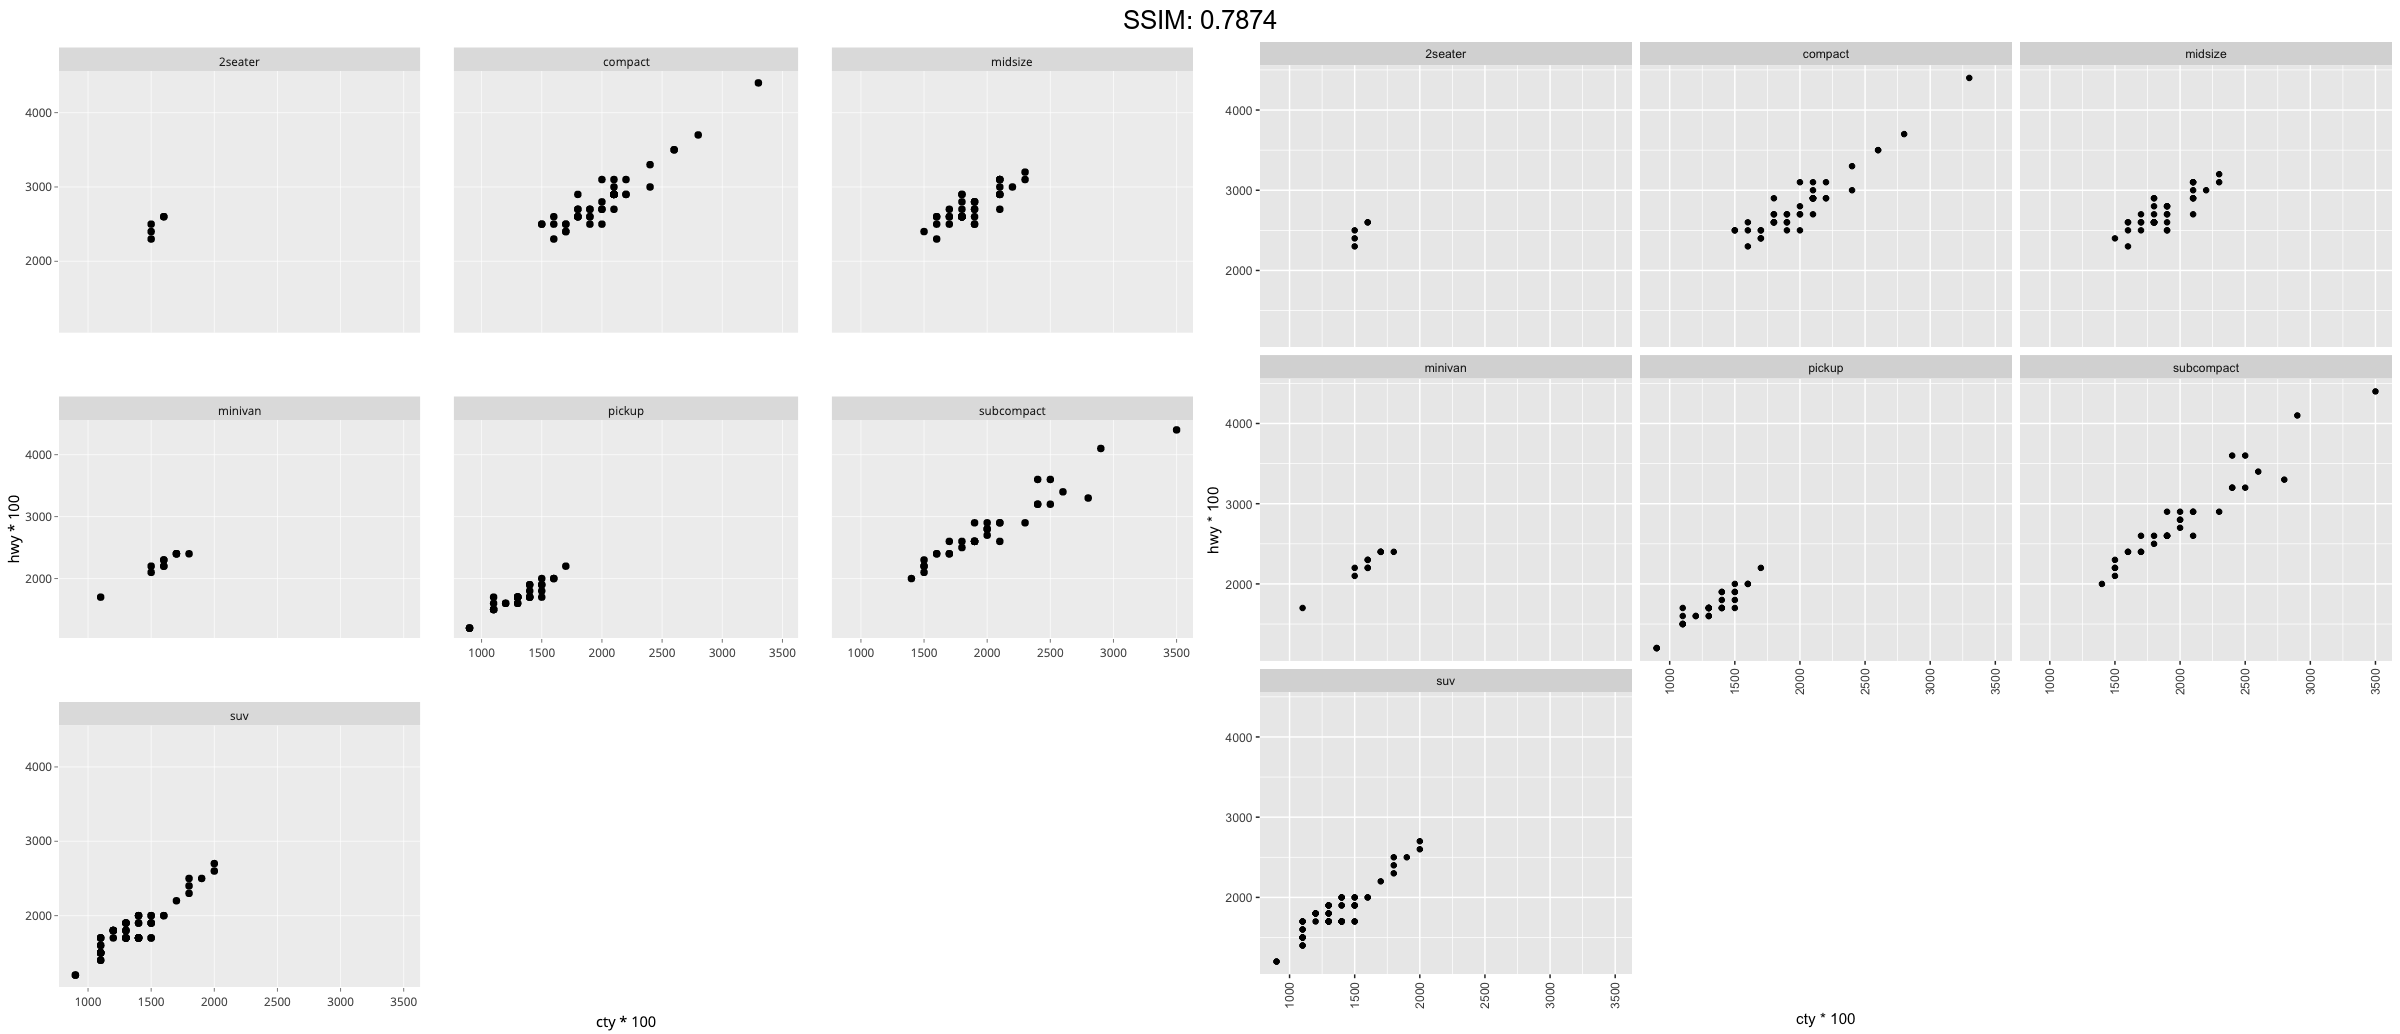
p <- ggplot(mpg, aes(cty * 100, hwy * 100)) +
  geom_point() +
  facet_wrap(vars(class))
p <-  p + guides(x = guide_axis(angle = 90))
plotly::ggplotly(p)

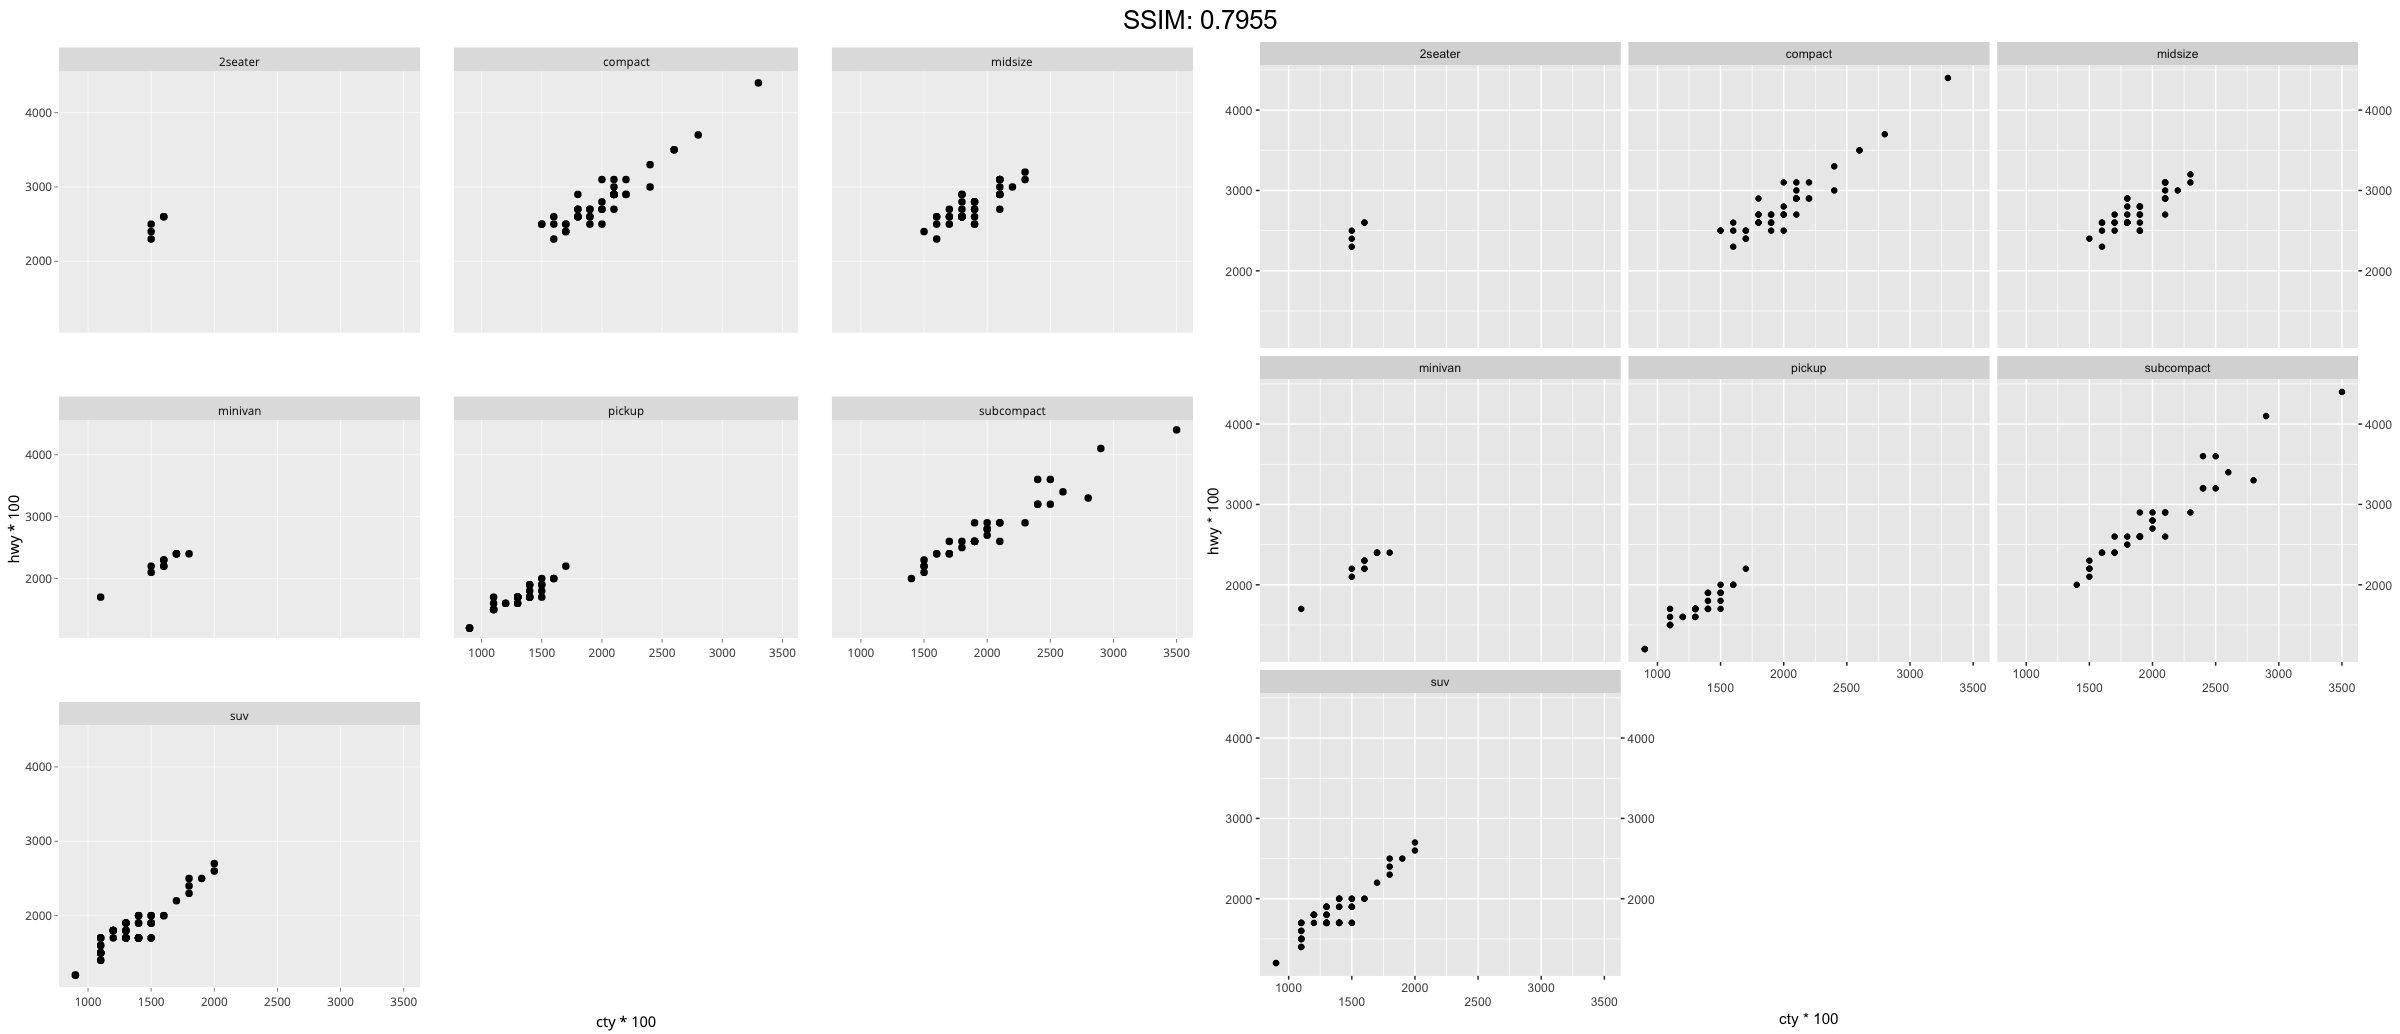
p <- ggplot(mpg, aes(cty * 100, hwy * 100)) +
  geom_point() +
  facet_wrap(vars(class))
p <-  p + guides(x = guide_axis(n.dodge = 2), y.sec = guide_axis())
plotly::ggplotly(p)